Output Node (Multiple Output Formats)
The Output Node is the final step for presenting workflow results. In addition to rendering Markdown, it now supports choosing an Output format to render content as HTML. The node does not generate content itself — it renders the value you select in Select output content. That value can come from a model, the Advanced Template node, or any node that produces an HTML string. All HTML is rendered inside a secure sandbox to protect your environment.
Usage
In the node configuration:
- Use
Select output contentto choose the text or template variable to render (e.g.,$Template1.template). - Choose an
Output format:- Markdown (default)
- HTML
Note: The output “content” is determined by Select output content. The “output format” only controls how it’s rendered.
Tip: Combine with the “Advanced Template” node to dynamically assemble/compose output before rendering.
Output format details
-
Markdown (default)
- Automatically renders Markdown into visual content.
- Great for summaries, reports, tables, and lists.
-
HTML
- This mode does not create content; it renders the value selected in
Select output contentas HTML. - That value may be produced by a model, the Advanced Template node, or any node that outputs an HTML string.
- Rendered in a sandbox; by default only HTML and CSS are executed.
- Optional toggle:
Allow scripts(off by default).- Off: static HTML only, scripts not executed.
- On: Enables JavaScript execution in an isolated environment (for interactive content); allows
<script>tags and external JS libraries for charts, animations, interactions.
- This mode does not create content; it renders the value selected in

Security and isolation
- All HTML is rendered inside a secure sandbox, isolated from the host environment.
- JavaScript is executed only when you explicitly enable the JS toggle.
- Prefer trusted sources for scripts and assets (CDNs are supported).
Example: Custom HTML (scripts disabled)
<!doctype html><html> <head> <meta charset="utf-8" /> <title>Result Preview</title> <style> body { font: 14px/1.6 system-ui, sans-serif; margin: 24px; } .card { border: 1px solid #eee; border-radius: 8px; padding: 16px; } </style> </head> <body> <h2>Analysis Result</h2> <div class="card"> <!-- Can be assembled by the Advanced Template node --> <p>Conclusion: {{ result.summary }}</p> </div> </body></html>Example: Model/Custom HTML (scripts enabled)
When Allow scripts is enabled, you can load libraries for visualizations (executed in an isolated environment):
<!doctype html><html> <head> <meta charset="utf-8" /> <title>Sales Chart Example</title> <script src="https://cdn.jsdelivr.net/npm/chart.js"></script> </head> <body> <h2>Monthly Sales</h2> <canvas id="chart" width="600" height="300"></canvas> <script> const ctx = document.getElementById('chart'); const data = {{ result.chartDataJson }}; // Injected via Advanced Template node new Chart(ctx, { type: 'line', data, options: { responsive: true } }); </script> </body></html>Markdown Syntax Support
Example test syntax:
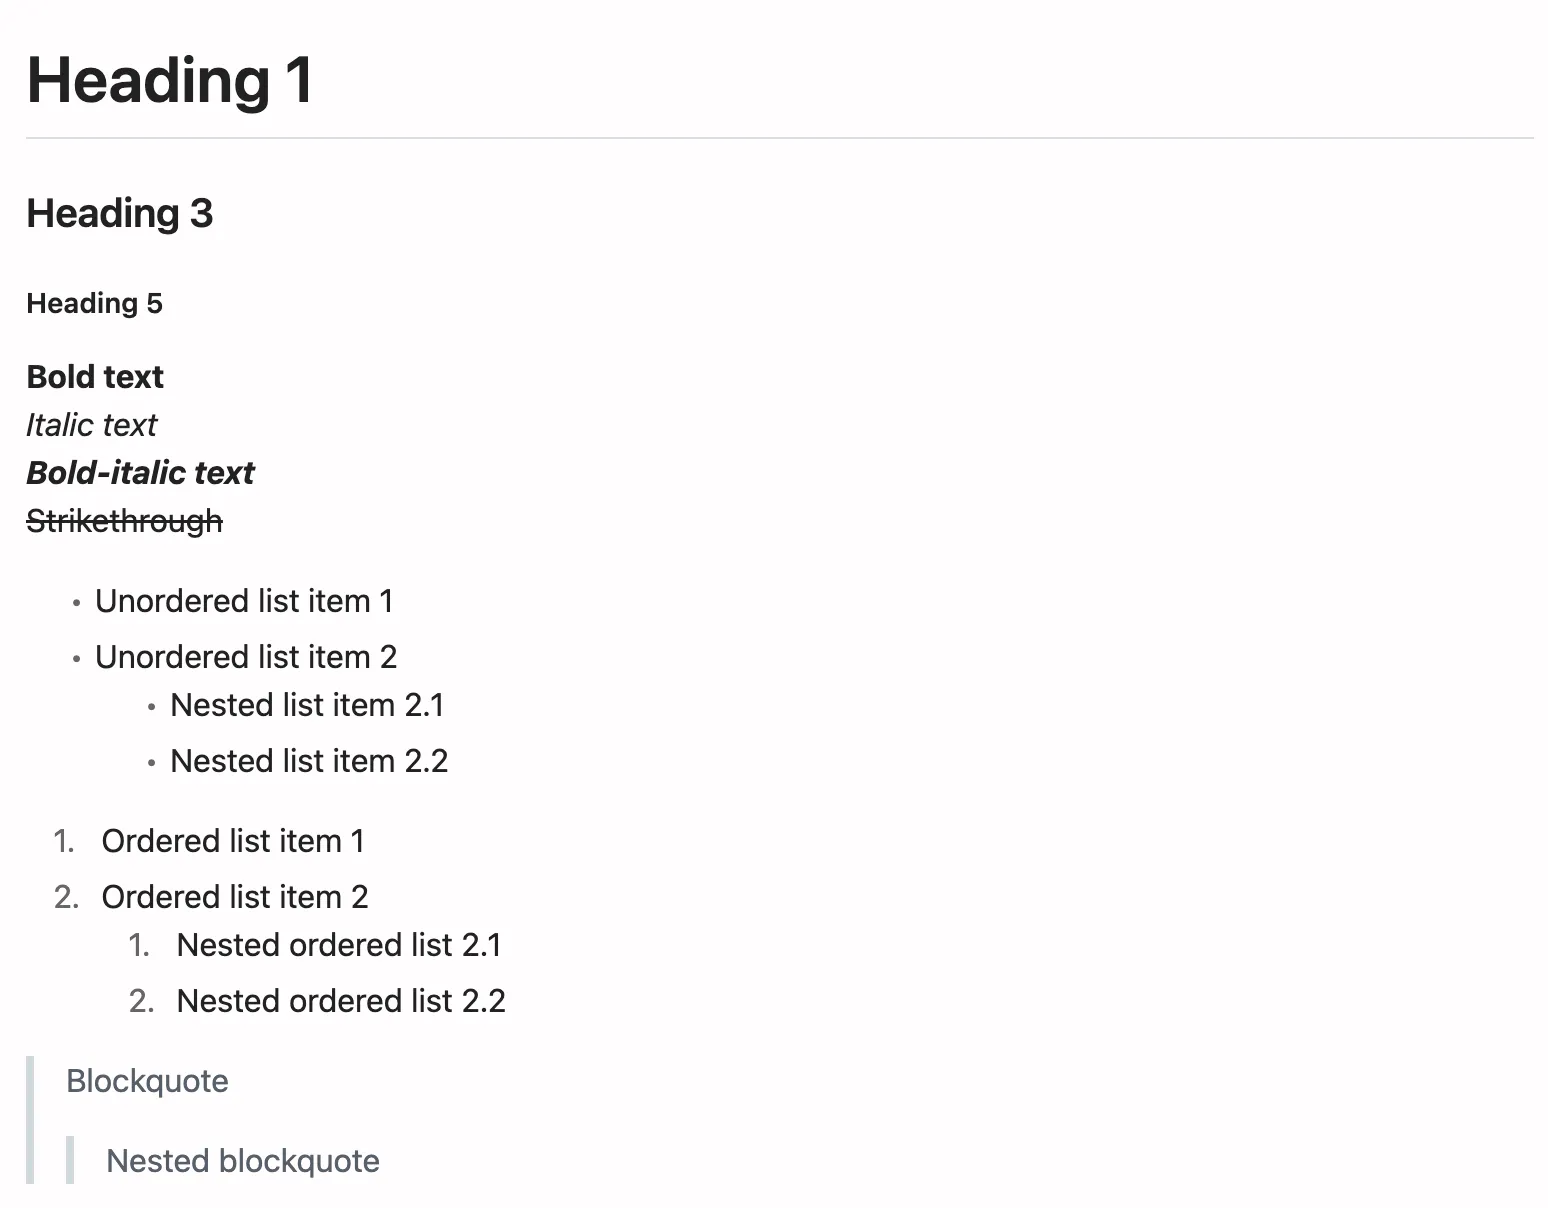
# Heading 1
### Heading 3
##### Heading 5
**Bold text**_Italic text_**_Bold-italic text_**~~Strikethrough~~
- Unordered list item 1- Unordered list item 2 - Nested list item 2.1 - Nested list item 2.2
1. Ordered list item 12. Ordered list item 2 1. Nested ordered list 2.1 2. Nested ordered list 2.2
> Blockquote>> > Nested blockquote
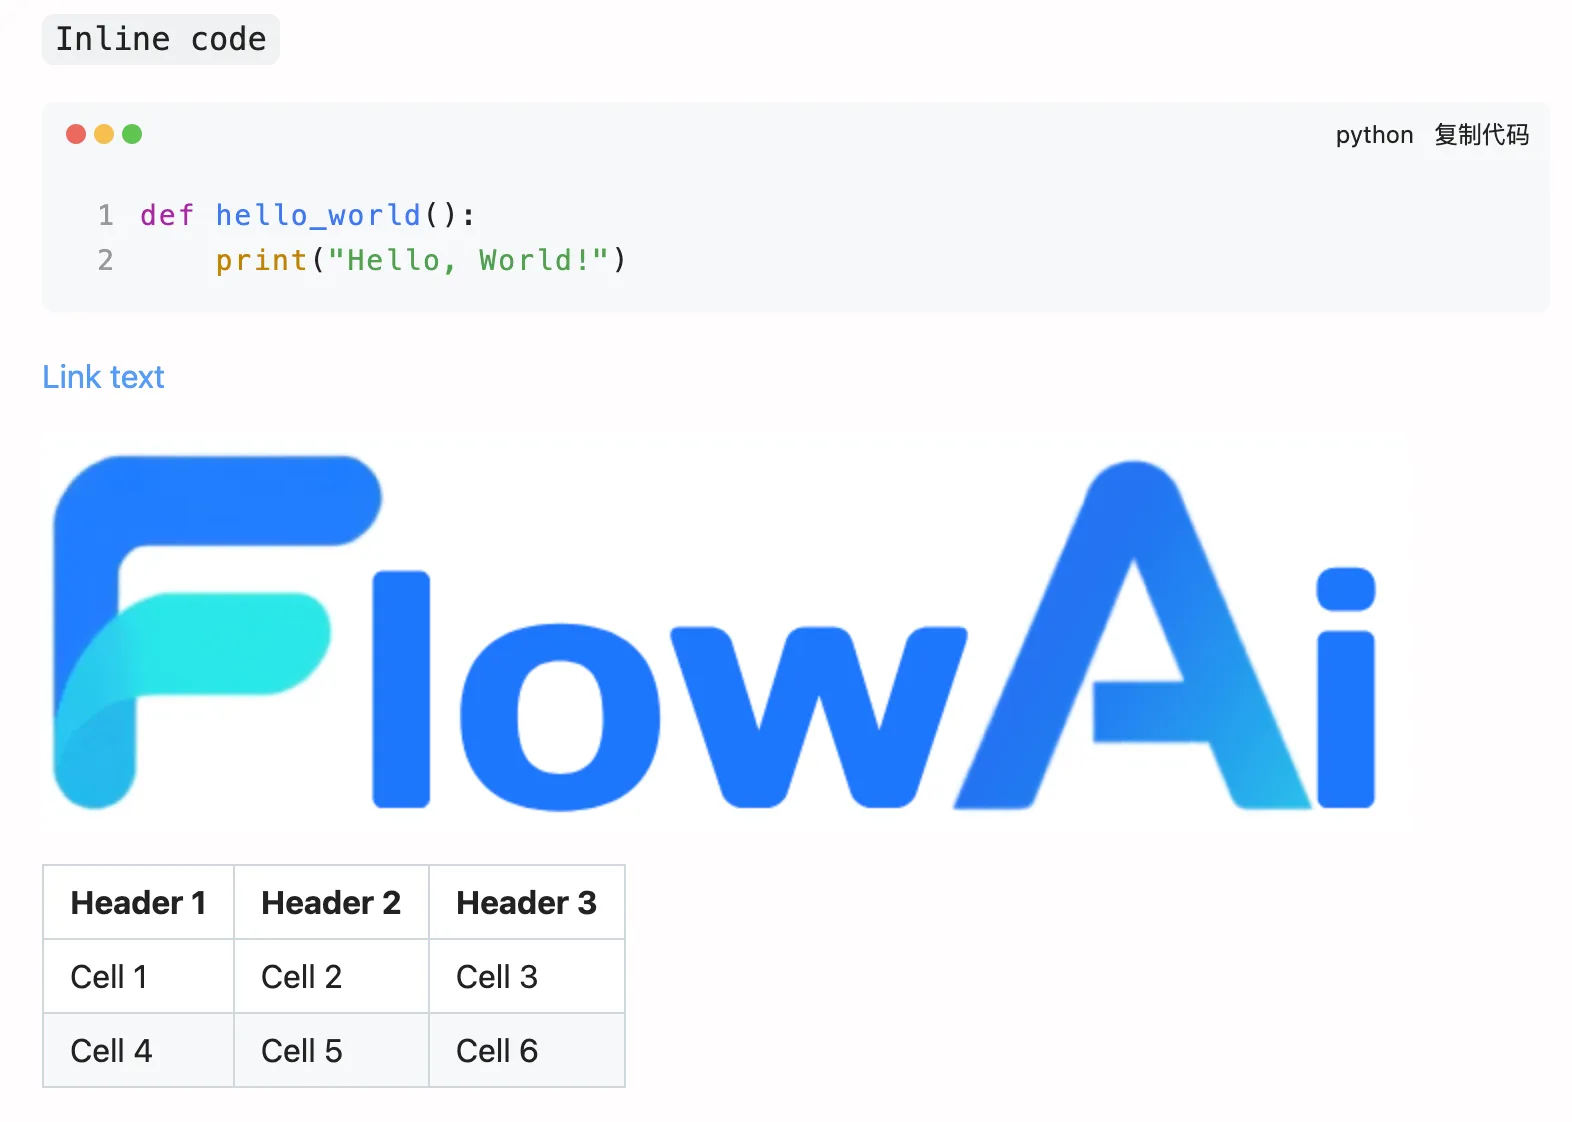
`Inline code`
```pythondef hello_world(): print("Hello, World!")```
[Link text](https://www.example.com)

| Header 1 | Header 2 | Header 3 || -------- | -------- | -------- || Cell 1 | Cell 2 | Cell 3 || Cell 4 | Cell 5 | Cell 6 |
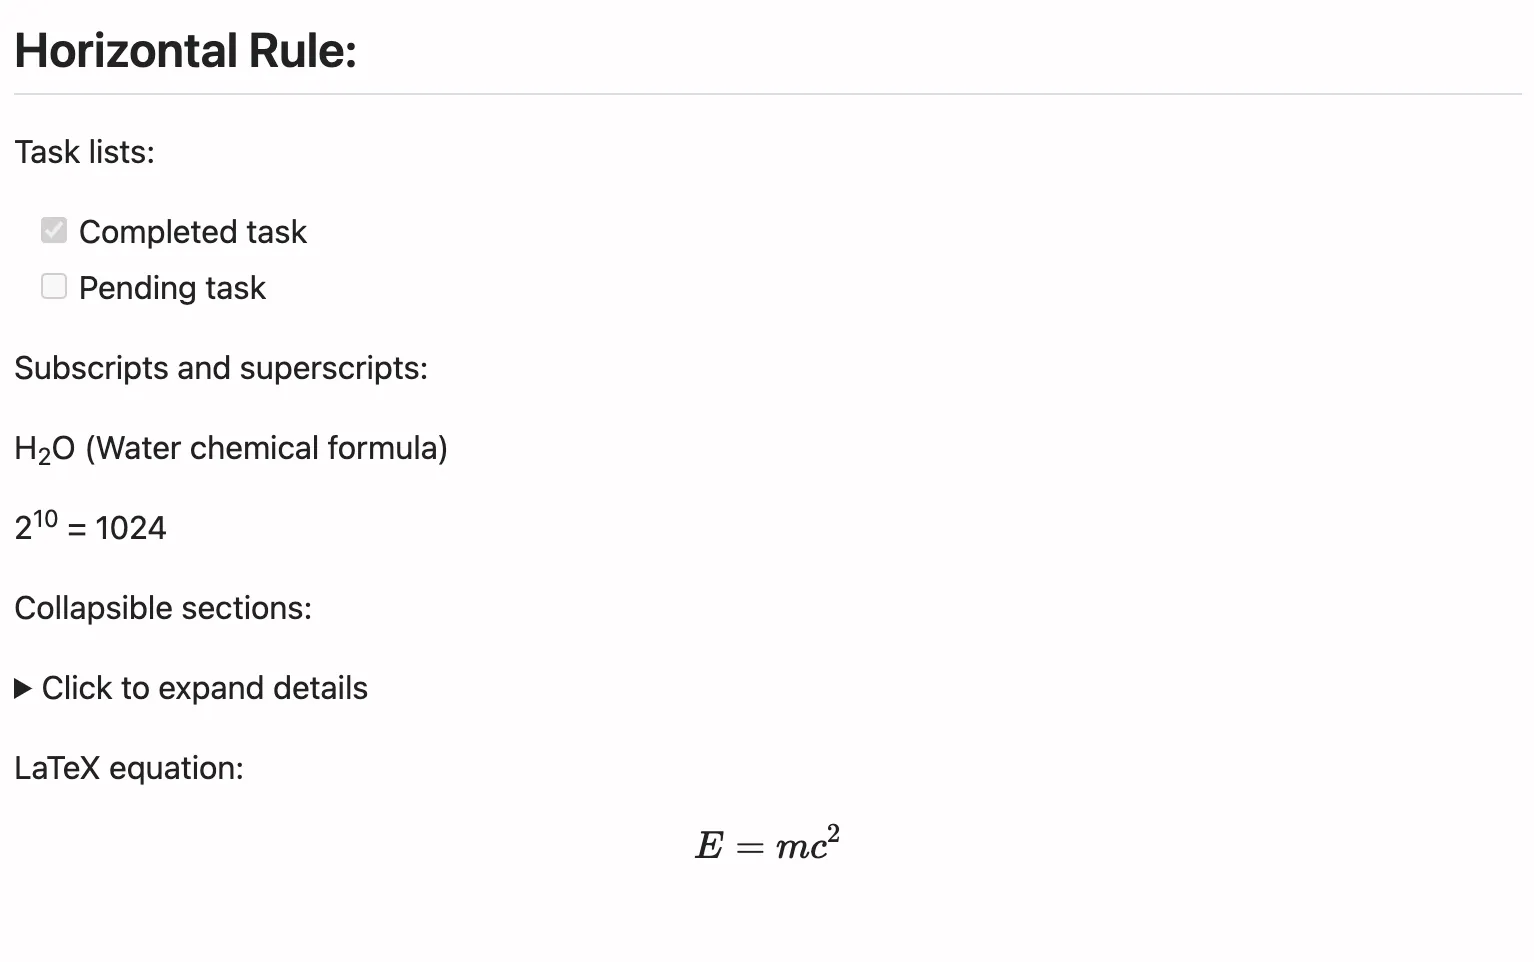
## Horizontal Rule:
Task lists:
- [x] Completed task- [ ] Pending task
Subscripts and superscripts:
H~2~O (Water chemical formula)
2^10^ = 1024
Collapsible sections:
<details><summary>Click to expand details</summary>
Hidden detailed content.Can contain multi-line text, lists, code blocks, etc.
</details>
LaTeX equation:
$$E = mc^2$$Sample output may appear as:
Mathematical Formulas & Mermaid Diagrams
Test with this Markdown syntax:
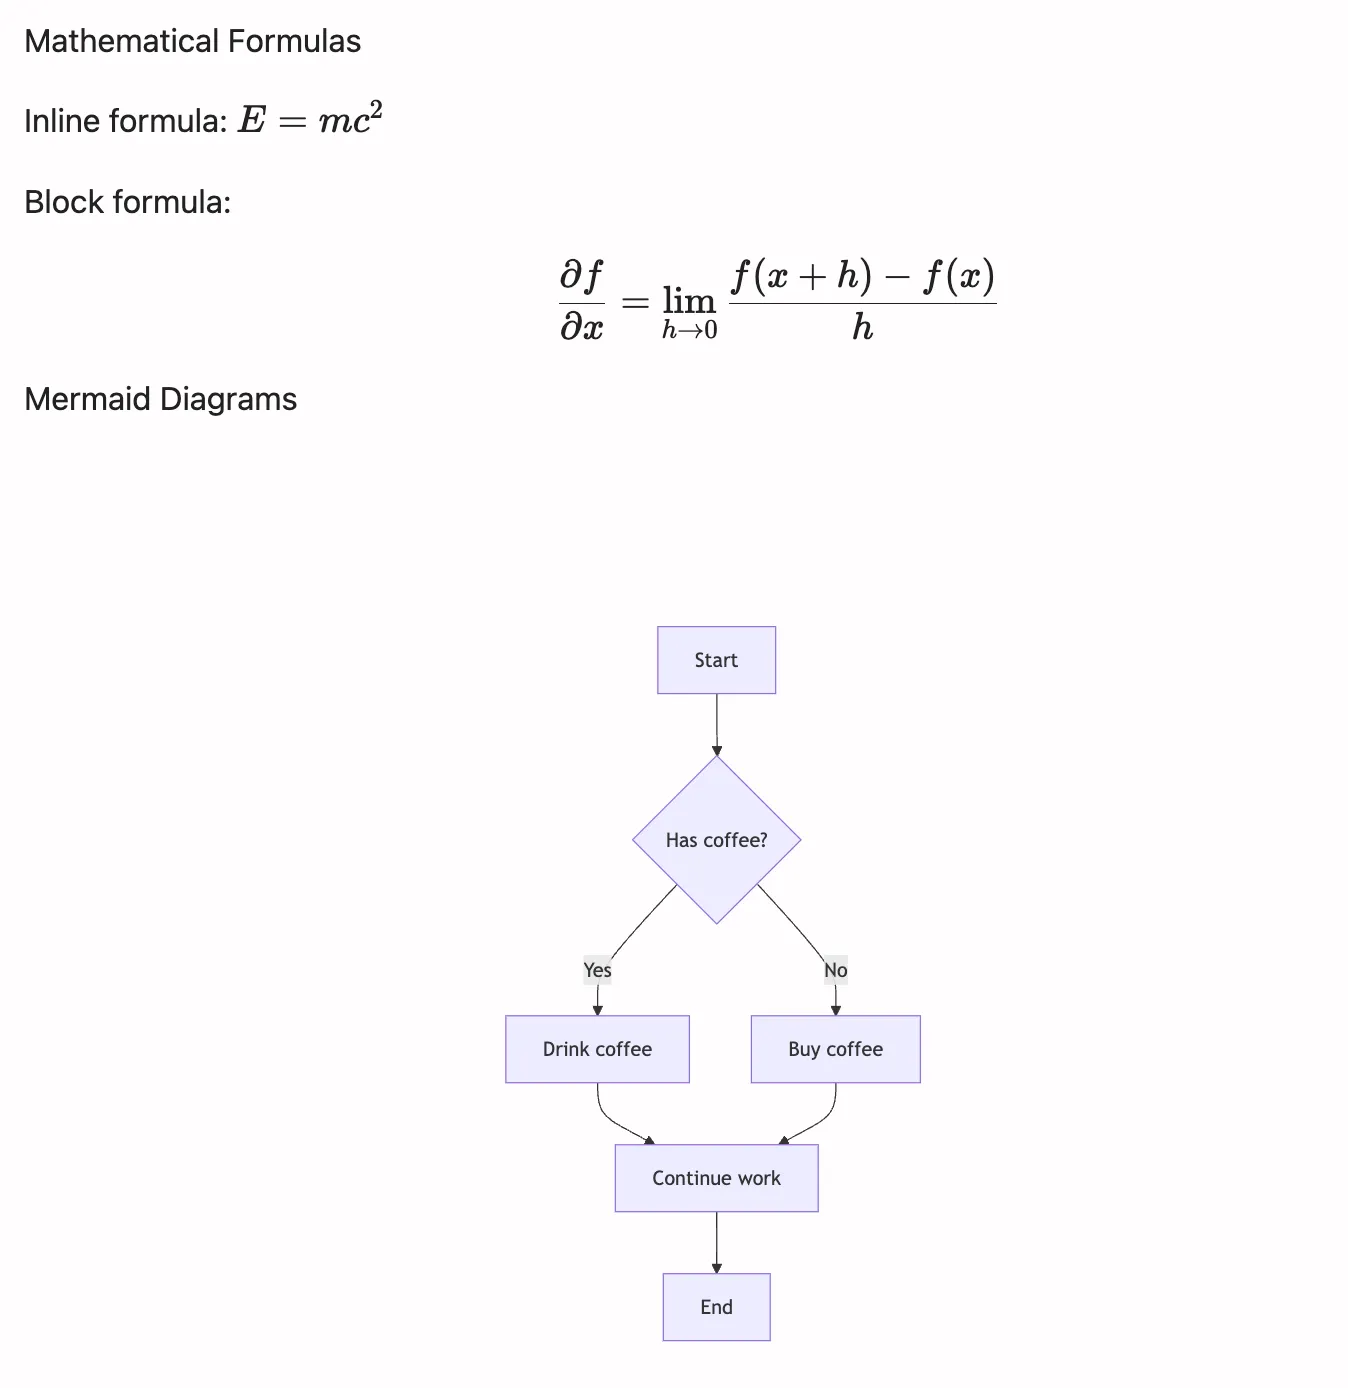
Mathematical Formulas
Inline formula: $E = mc^2$
Block formula:
$$\frac{\partial f}{\partial x} = \lim_{h \to 0} \frac{f(x + h) - f(x)}{h}$$
Mermaid Diagrams
```mermaidgraph TD A[Start] --> B{Has coffee?} B -->|Yes| C[Drink coffee] B -->|No| D[Buy coffee] C --> E[Continue work] D --> E E --> F[End]```
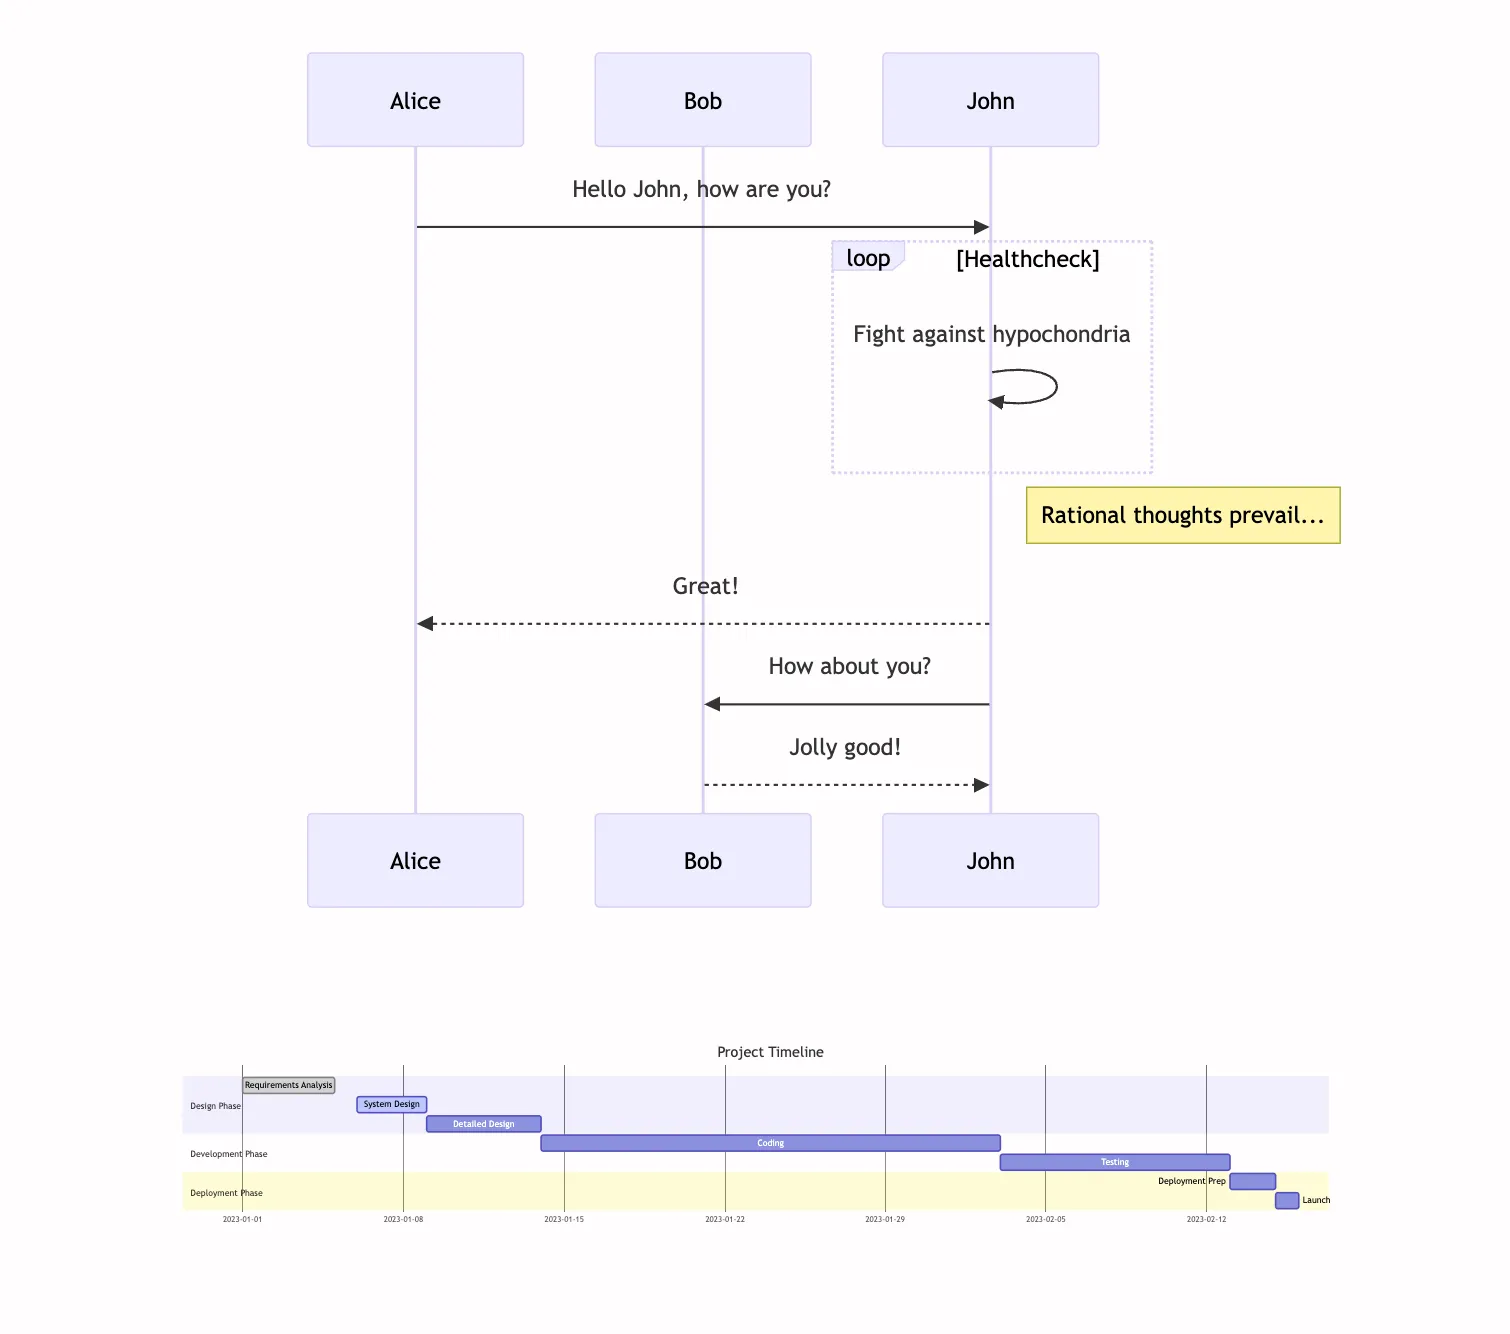
```mermaidsequenceDiagram participant Alice participant Bob Alice->>John: Hello John, how are you? loop Healthcheck John->>John: Fight against hypochondria end Note right of John: Rational thoughts <br/>prevail... John-->>Alice: Great! John->>Bob: How about you? Bob-->>John: Jolly good!```
```mermaidgantt title Project Timeline dateFormat YYYY-MM-DD section Design Phase Requirements Analysis :done, des1, 2023-01-01, 2023-01-05 System Design :active, des2, 2023-01-06, 3d Detailed Design : des3, after des2, 5d section Development Phase Coding : dev1, after des3, 20d Testing : dev2, after dev1, 10d section Deployment Phase Deployment Prep : dep1, after dev2, 2d Launch : dep2, after dep1, 1d```Sample output may appear as:
Need a Custom AI Agent?
Custom AI agents designed for real-world business operations.